


A Capt. Ryan Study · September 2026
The Great Wall-Off: A 12-Day Study
How the Gulf Stream got pushed offshore, held there by an eddy, and then snapped back to the reef — explained simple.
What This Study Is About
Between September 15 and September 27, 2026, something big happened off the Florida Keys. The Gulf Stream — the big river of warm water that flows north past the Keys — got pushed far offshore. Then it came back. This study shows what happened, day by day, using real data and satellite charts.
You will learn three things: (1) what pushed the Stream offshore, (2) why it came back, and (3) why the full moon made it come back faster.
Altimetry: The Missing Layer That Ties It All Together
The charts in this study show you where the slow and fast water is right now. But altimetry — sea surface height anomalies — shows you why it is there, and what it is doing to the bait. In simple terms: when the sea surface is slightly higher than normal, water is piling up and pushing down (downwelling). When it is slightly lower, deep nutrient-rich water is being pulled up to the surface (upwelling). Upwelling feeds the food chain. That is what creates the purple nutrient-rich filament you saw in the wall-off study. Watch this video to learn how to read altimetry, spot upwelling vs. downwelling, and turn those lines into waypoints for wahoo, snapper, and grouper.
Learn How to Read Altimetry the Correct Way by Dr. Jeffery Barr with SatFish.
- How to Read Altimetry: Understanding sea surface height anomalies (upwelling vs. downwelling) and what they mean for bait concentrations — and how that helps you catch more wahoo.
- South Florida, Gulf & Keys Specifics: Navigating the complex current dynamics, eddies, and rips unique to our local waters.
- Targeting Pelagics & Bottom Fish: Translating altimetry lines into actionable waypoints for wahoo, snapper, and grouper.
If you would like more information, then check out the 4-Week SatFish Masterclass by clicking the link below:
The Short Version
A spinning pocket of water called an eddy formed near the Dry Tortugas. It pushed the Gulf Stream's western wall far offshore — the farthest it had been all summer. The wall stayed out for about 10 days. Then the eddy relaxed, and the wall snapped back to the reef. A full moon at the same time made the slow water flush out faster.
The number that matters: At Alligator Reef (Upper Keys), the wall went from 15 nautical miles offshore on September 15 to 4 nautical miles on September 25. That is an 11-mile swing in 10 days.
What Is the "Wall"?
The Gulf Stream has a western edge — the line where the fast blue water starts. Fishermen call this the "wall." When the wall is close to the reef, you can reach the blue water fast. When the wall is far offshore, you have a long run to get to it.
The wall moves. It is not fixed. Currents, eddies, and wind push it around. This study tracks one big move.
The Calibrated Color Key (Straight Off the SatFish Legend)
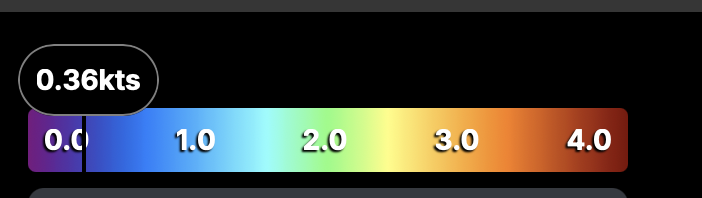
This is the exact SatFish current-speed legend, pulled off the chart. Purple is not depth. Purple is slow current — 0.0 to 0.5 knots. That is the whole key. Once you know purple = slow, the filament reads itself: it is a tongue of purple (slow water) extending out from the eddy. The fast Florida Current is green to red. Here is the legend, then what each band means for the read:
SatFish current-speed color legend: purple 0.0 kts to red 4.0 kts. The SatFish current-speed scale. The indicator shows 0.36 kts in the deep purple zone — that is the slow-water band where eddies, countercurrents, and upwelled water live. This is the band a filament reads in.
How to read a filament with this key: Look for a tongue of deep purple (0.0–0.5 kts) extending out from a slower zone toward or along the reef tract. That purple tongue IS the filament — slow, eddy-spawned water. Fish the blue/cyan edge where the purple meets the green fast water — that shear line is where the predators stack. The hard wall data (Alligator 15 NM) tells you the wall is off; this color key tells you where the slow-water filament is sitting.
The Timeline (In Order)
This is the peak. There is no chart image for this date — we know it from hard data measured by the Navy's oceanographic office. Here is what the numbers showed:
What this means: At Alligator Reef, the wall pushed 9 miles farther offshore in just 4 days. At the Dry Tortugas, it pushed 38 miles offshore. That is a huge move. Miami stayed tight — the eddy had not reached that far north yet.
This is the first chart. It shows the wall still pushed offshore. The purple color means slow water (0 to 0.5 knots). The green and yellow means fast Gulf Stream water (2 to 3 knots). The purple water filling the gap between the Keys and the Stream is the "wall-off" — slow water where the fast edge used to be.
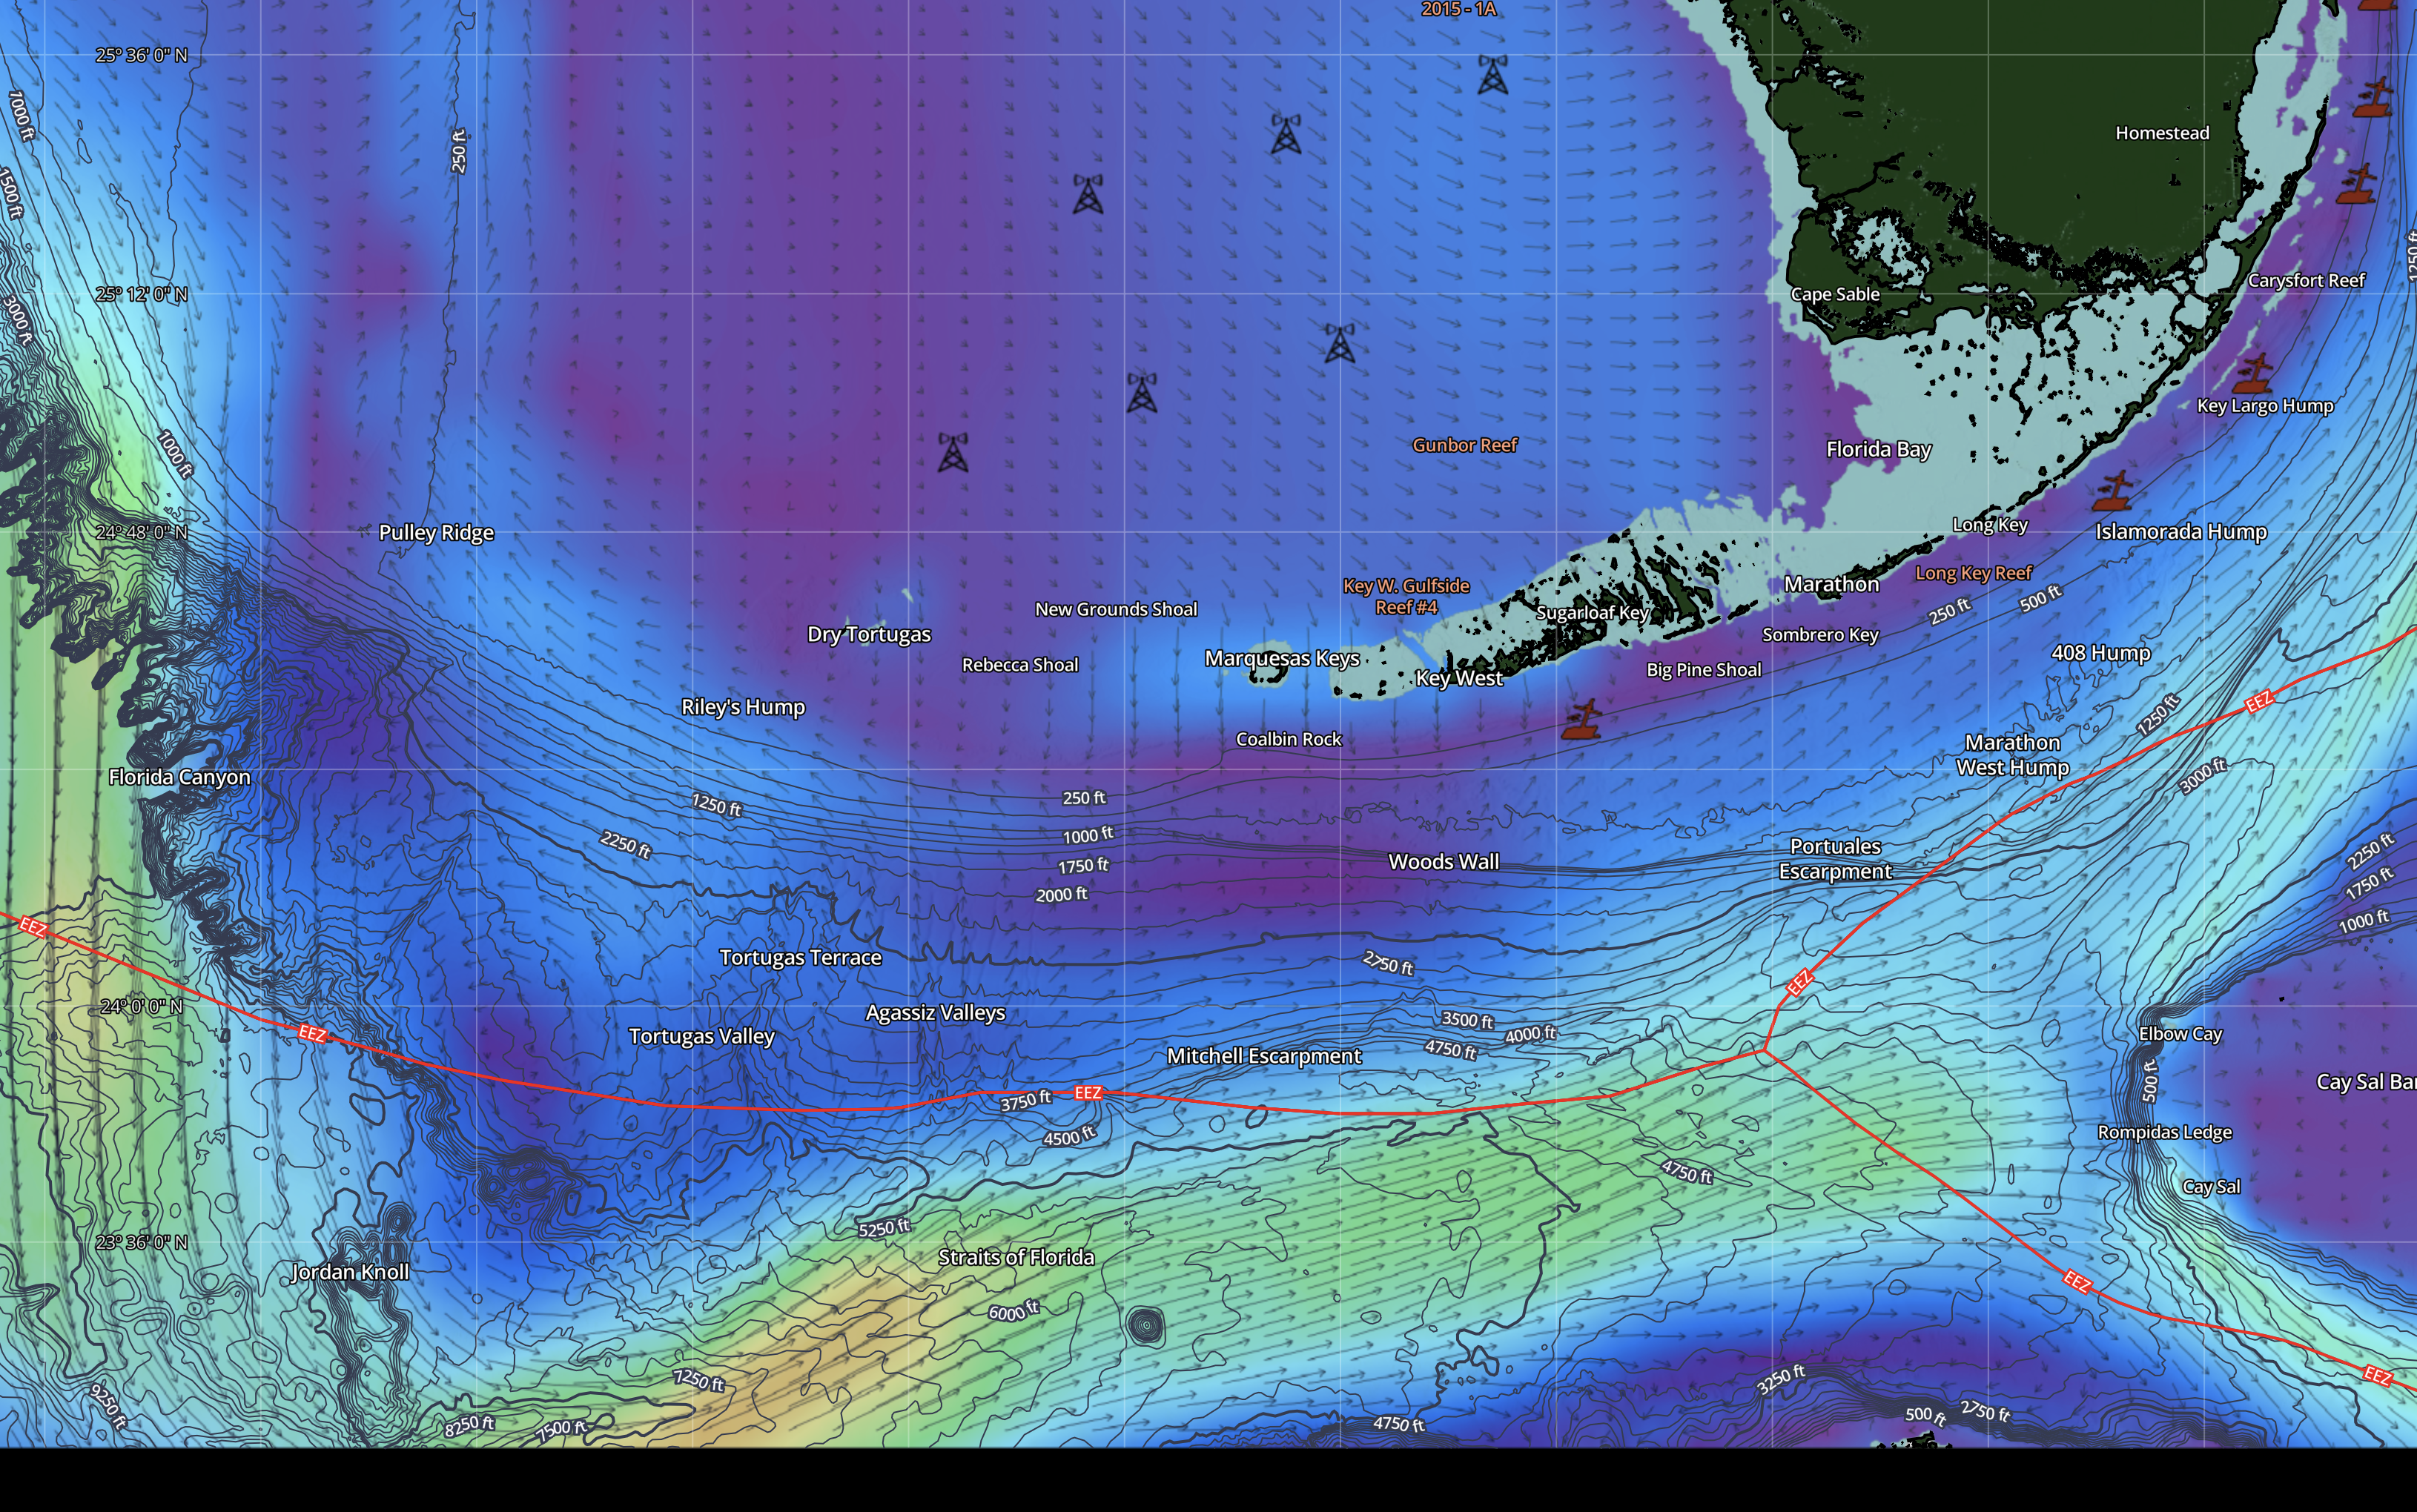
What is the filament? The long tongue of purple water stretching along the underwater slope is called a filament. It is slow, nutrient-rich water leaking out of the eddy. Think of it like food water — where it meets the fast blue water, bait stacks up and predators hunt.
This is the second chart, taken later the same day. The pattern is the same. Purple still fills the gap. Green and yellow is still pushed south. The eddy is still parked. Nothing has broken down yet.
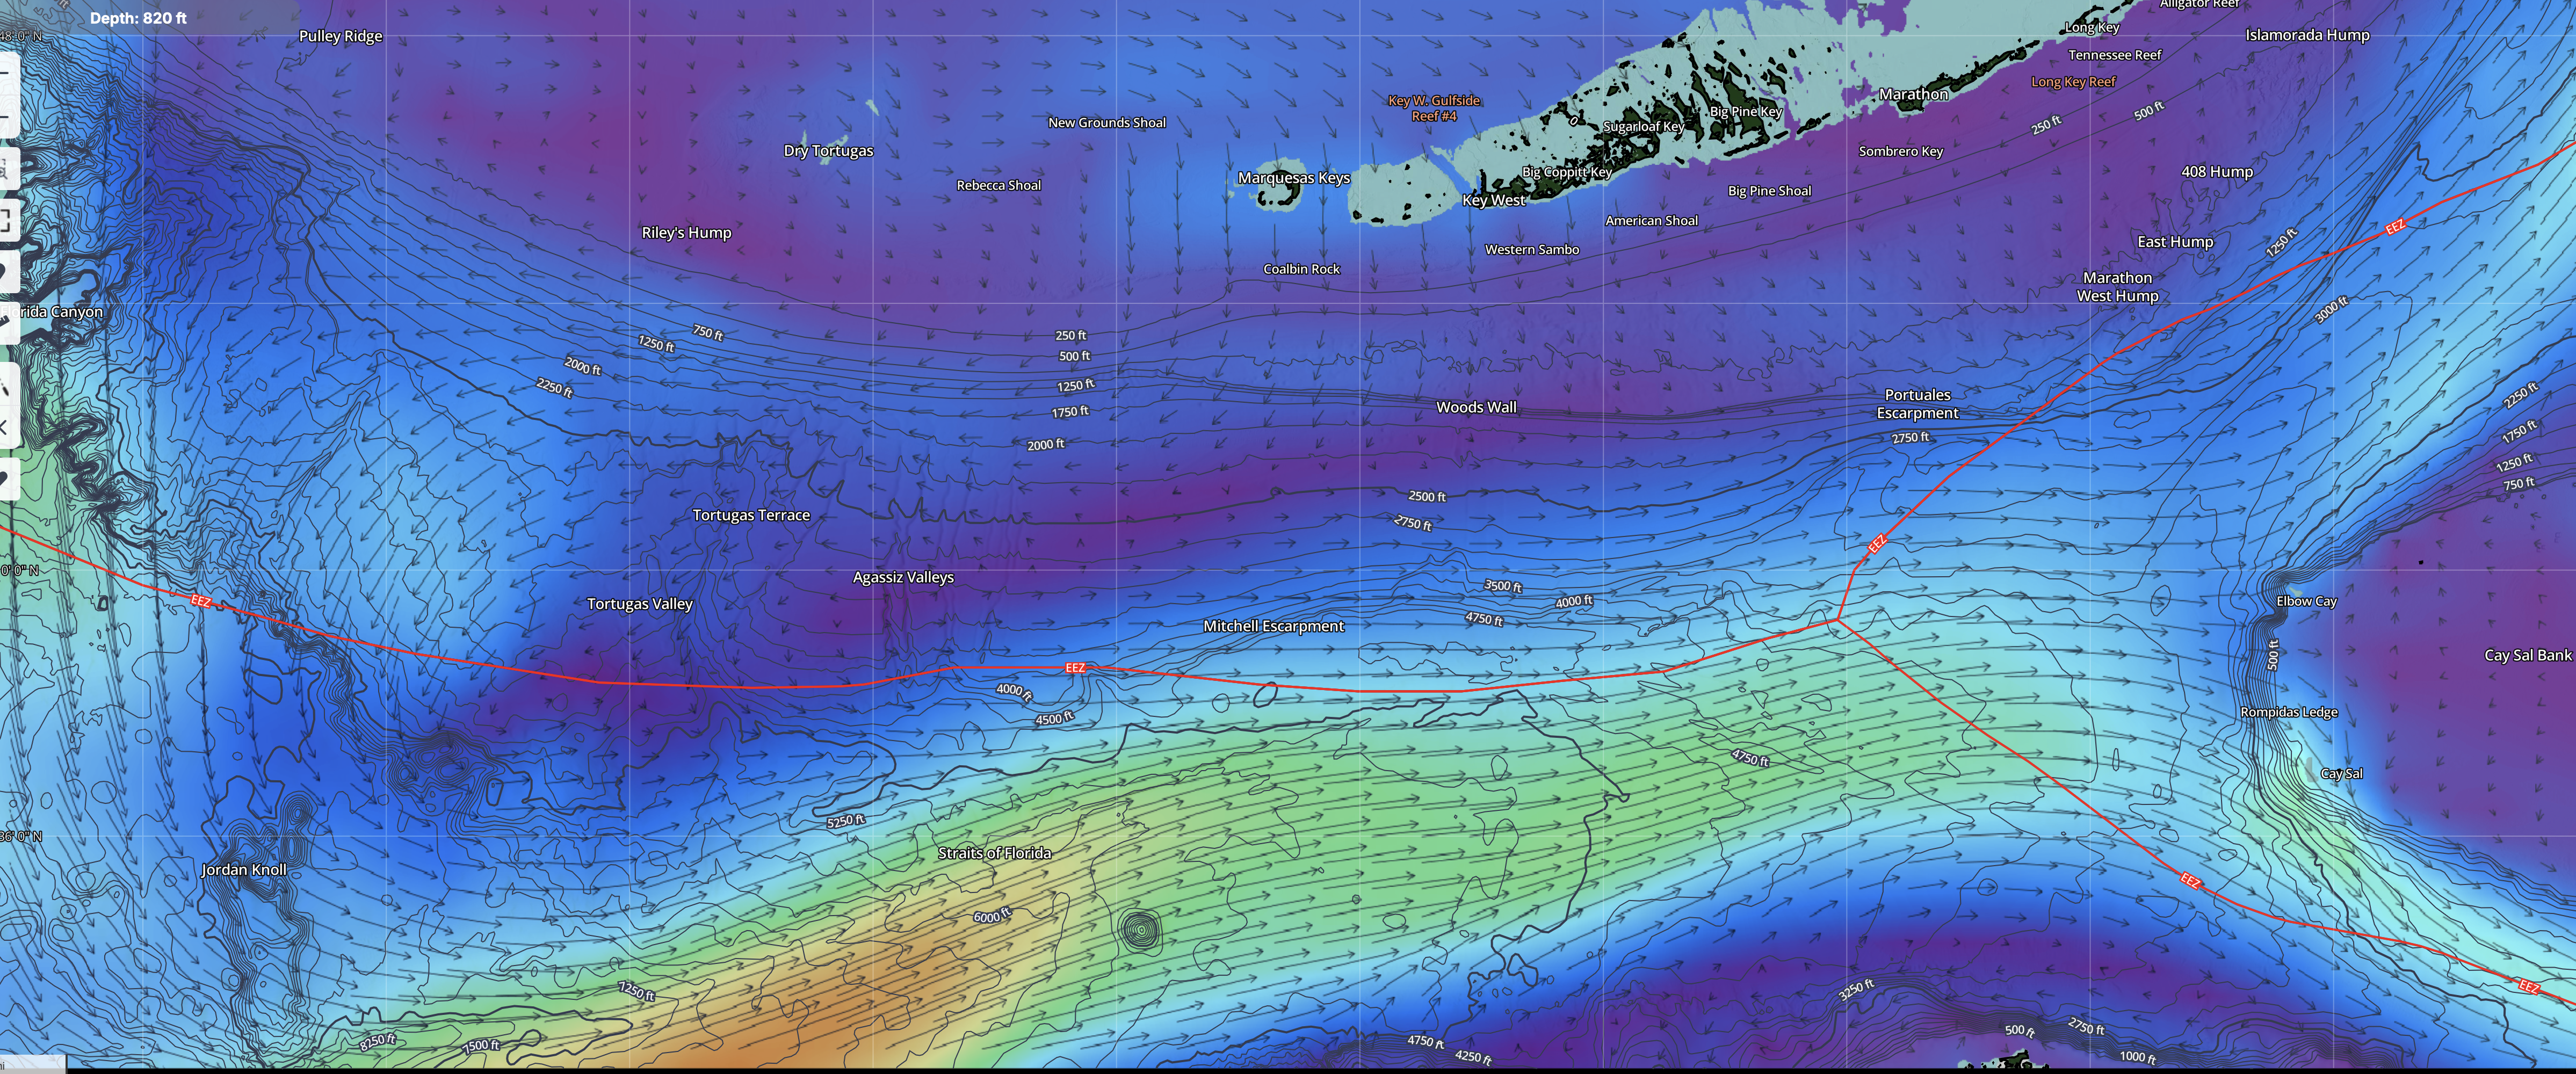
The two edges: There are two edges on this chart, not one. The main wall edge (purple to green/yellow) is 15 miles offshore — a long run. But there is a second edge closer to the reef (purple to teal) where the slow water meets faster water. That inshore edge holds fish too, and you do not have to run as far to reach it.
The hard data from September 25 shows the wall came back. Then the chart from September 27 shows it. Here is the proof:
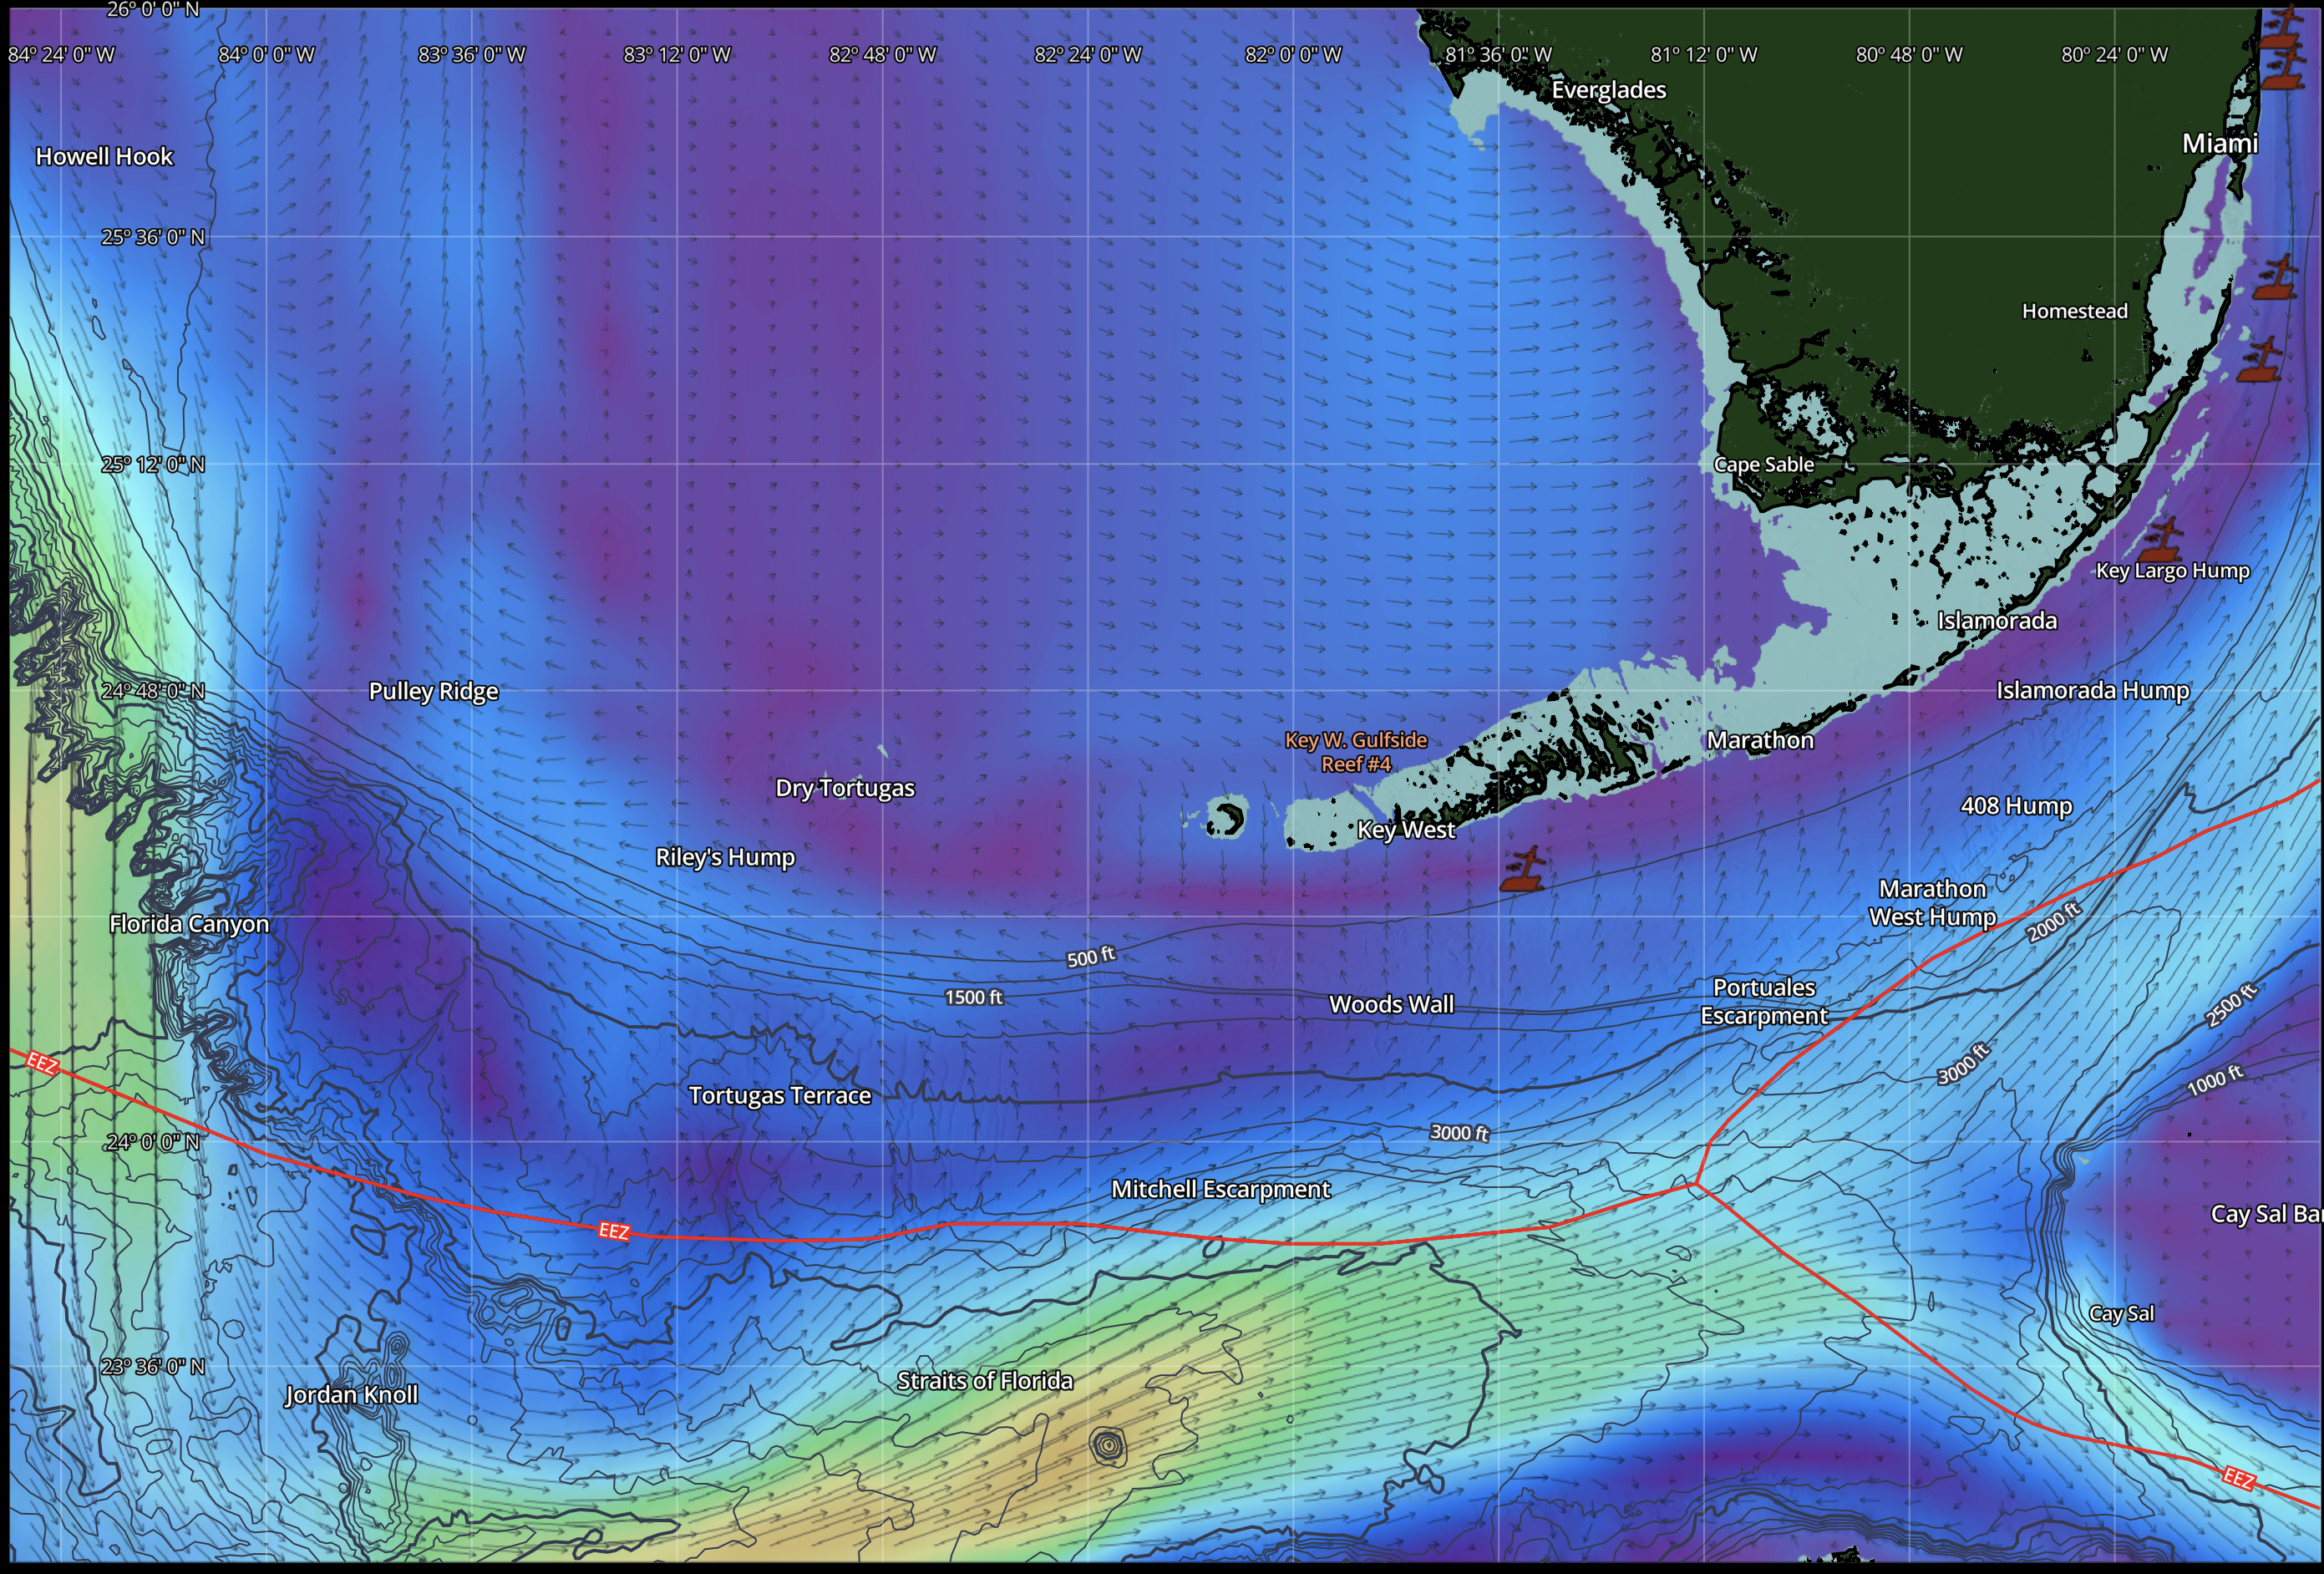
What happened: The eddy's push relaxed. The Gulf Stream pushed its wall back toward the reef. The slow purple water that was filling the gap got flushed out. That is what you see on Chart 3 — the cleanup.
Why Did the Wall Go Out and Come Back?
Why it went out
A spinning pocket of water called an eddy formed near the Dry Tortugas. Eddies are like slow whirlpools. This one pushed against the Gulf Stream and shoved its western wall offshore. Research by oceanographers (Fratantoni in 1998, Lee and Williams in 1988) documented that Tortugas eddies do exactly this — they displace the Florida Current seaward.
Why it was not wind
Wind-driven pushes relax when the wind dies. Eddy-driven pushes stay as long as the eddy sits. The wall pushed out, relaxed a little, then pushed out AGAIN even further. That re-strengthening pattern is the fingerprint of an eddy, not wind.
Why it came back
The eddy's push relaxed. When that happened, the Gulf Stream pushed its wall back toward the reef. The wall did not slowly drift back — it snapped back 11 miles in about 10 days. That is a fast move for something this big.
Wait — Wasn’t There a Nor’Easter Too? Did That Push the Wall Back?
This is a fair question, and the answer matters if you want to read these events correctly. During the same window, a Nor’Easter was parked north of the Gulf Stream, pushing swells south and backing up water along the Eastern Seaboard. That storm is real. It caused the Coastal Flood Warnings and the high water under the bridges. But here is the honest line:
The wall coming back was the eddy relaxing
The wall snapping from 15 NM offshore back to 4 NM at Alligator Reef is the eddy’s push relaxing. That is what the hard data shows. We do not have proof that the Nor’Easter arrived before September 25 and shoved the wall in. The timing of the wall return lines up with the eddy relaxing, not with the Nor’Easter’s wind field reaching the Keys.
The Nor’Easter is a flooding event, not a wall event
The Nor’Easter backs up water and raises sea level along the Keys. That is what causes the coastal flooding and the reduced bridge clearance. It is a separate event from the wall movement. The Nor’Easter may be helping hold the wall in close right now, but the wall coming back in was the eddy relaxing — not the Nor’Easter pushing it.
Why this distinction matters on the water
If you blame the wall return on the Nor’Easter, you will start watching Eastern Seaboard storms to predict the wall. That will burn you. The wall moves with eddies, not with nor’easters. Watch the Tortugas eddy cycle and the satellite charts for the purple filament. That is what actually tells you when the wall is coming back.
The simple version: Two separate things happened at the same time. The eddy relaxing brought the wall back to the reef. The Nor’Easter backed up the water and caused the flooding. Do not mix them up — they look related, but they are driven by different forces and they predict different things.
When Did the Nor’Easter Actually Show Up?
Here is the real timeline, from the news and the National Weather Service. This is so you can see exactly when this storm arrived and how it lined up with the wall coming back:
The honest read: The Nor’Easter arrived on the East Coast around Sept 24–25. The wall snapped back on Sept 25. So yes, they overlapped in time. But the Nor’Easter’s wind was hitting the Mid-Atlantic (New Jersey to North Carolina), not the Keys directly. The wall is measured at the Keys. The eddy relaxing is still the main reason the wall came back. The Nor’Easter’s job in the Keys was backing up the water and causing the flooding — not pushing the wall in.
Did the Full Moon Spring Tides Help?
The full moon happened right around September 26. Full moons create spring tides — stronger outgoing and incoming tides than normal. Here is the honest answer in two parts:
What the tide did NOT do: It did not pull the wall back inshore. The wall snapping back is a big ocean event driven by the eddy relaxing. Tides are too weak to shove the wall 11 miles. The tide did not move the wall.
What the tide DID do: It sped up the cleanup. The strong spring outgoing tides pushed the slow purple water out of the gap faster than a normal tide would. Think of it like a broom sweeping the slow water out while the wall came back in. That is why the transition looked fast and clean instead of slow and muddy.
So: the eddy relaxing brought the wall back. The full moon spring tides just helped flush the leftover slow water out faster.
Why Is the Data Always a Few Days Old?
You might wonder why we sometimes had to wait 10+ days for a new wall reading. Here is why the data lags, in simple terms:
Why this matters: This is why we used the satellite charts to see what was happening right now, and the NOAA wall data as the hard proof of where the wall was. The charts are real-time. The data is lagged. During a fast event like this, the chart shows the change before the database does.
Three Things to Remember
1. The wall-off was caused by an eddy, not wind. The wall pushed out, relaxed, then pushed out even further. That re-strengthening pattern is the fingerprint of an eddy. Wind pushes do not re-strengthen.
2. The wall coming back does not mean the eddy left. It means the eddy's push relaxed. The Gulf Stream pushed its wall back. The slow water you saw moving was just getting flushed out.
3. The full moon sped up the cleanup, not the wall. The spring tides flushed the slow water out faster. The tide did not move the wall — the eddy relaxing did that. The tide just made the mess clear up quicker.
Ready To Start Catching Wahoo Consistently — Join Our New Advanced Wahoo Playbook 8-Week Intensive
Inside the new Advanced Wahoo Playbook 2026–27 Intensive, you get eight weeks of comprehensive breakdown, live Q&A, and direct access to top-tier expertise.
There will be a deep-dive session with Dr. Jeffery Barr, PhD, Chief Scientist at SatFish, sharing critical offshore insights and strategy. This is your opportunity to learn from some of the best in the industry.
Turn these contour lines into consistent wahoo in the box this season.
How to Read the Chart Without Getting Fooled
Someone asked a really good question: "Just because the chart says purple and slow, does that mean the water is actually slow? We have tides that move the water. Can the chart trick you?" The answer is yes, it can trick you — if you do not know what the colors really mean. Here is the breakdown, in simple terms.
Two different things on the chart
There are two things on the chart, and they are easy to mix up. First, what the water IS — its temperature, its nutrients, its salt. This is the "water mass." The purple eddy water is a cold, nutrient-rich water mass. That does not change when the water moves. Second, how fast the water is MOVING — this is what the colors actually show. Purple means slow. Green means fast. The speed changes every few hours with the tide. But what the water IS does not change.
The tide moves the water, but does not change it
When the purple nutrient-rich water is sitting still, the chart shows purple. A few hours later, the outgoing tide grabs that same water and pushes it offshore. The water starts moving, so the chart turns green. But it is the SAME water. Same nutrients. Same temperature. Same bait. The only thing that changed is the speed. The tide moved the good water without ruining it.
The optical illusion for new people
A new reader sees green on the chart and thinks "fast water, no nutrients, bad fishing." That is the illusion. The green might be nutrient-rich eddy water that the tide grabbed and pushed offshore. The color tells you the speed, not the quality. You have to know where the purple was, and understand that the tide moves that water without changing what it is. That is the skill of reading these charts.
Filaments last for days, tides last for hours
A filament is a tongue of eddy water that extends out from the main eddy. It is a water mass, not a wave, so it does not come and go with the tide. Once a filament forms along the slope, it can sit there for 3 to 10 days. The nutrients, the bait, the food chain — all of that stays in the filament for days. But the tide cycles every 6 hours. So the filament gives you the where (it will be there for days). The tide gives you the when (fish the outgoing tide when the good water flows offshore and meets the blue water).
The simple formula for fishing this:
- Find the purple filament on the chart — that tells you the good water is there, and it will be there for days.
- Check the tide table for your fishing day — find the outgoing tide windows.
- Fish the outgoing tide along the edge of the filament where it meets the blue water — that is when the nutrients flow out and the predators feed.
- The filament will still be there tomorrow — so you can plan multiple days around the same feature, just timing each day to the tide.
The honest catch: The filament lasts for days, but it does change slowly. It can thin out, it can detach, it can get pushed by wind. So check the latest chart you can get, and trust your boat's electronics — temperature breaks, color changes, bait marks — to confirm the filament is still where the chart said it was. The chart tells you the pattern. The tide tells you the timing. Your boat tells you the truth.
The First Cold Front: Wind Pushes It Out, Tide Brings It Back
On September 26, the first cold front of the season pushed through the Florida Keys. North wind blew. This is exactly the kind of event that moves the nutrient-rich filament water around. Here is what happens, in simple terms, and why it matters for fishing.
Step 1: The north wind pushes the good water offshore
When a fall front hits and the north wind blows, it does two things at once. The wind physically pushes the surface water offshore (this is called "Ekman transport" — the wind drives the top layer of water away from shore). At the same time, the outgoing tide is also pushing water offshore. So the nutrient-rich filament water gets shoved further offshore than it would from either force alone. It can get pushed past the underwater shelf edge, out into the deep blue Straits water — into the zone where wahoo do not want to be this time of year.
Step 2: The wahoo pull back and wait
In fall, wahoo want the edge close to the reef. They are here to feed on the bait that stacks up along the reef edge and the nearshore wall. When the filament water — and the bait in it — gets blown way offshore past the shelf, the wahoo either follow it out there (away from where you can reach them easily) or they pull back and wait. The bite can go quiet, not because the fish left, but because the food got pushed out of reach.
Step 3: The wind relaxes, but the eddy is still there
Here is the key: the north wind relaxing does not mean the good water is gone. The eddy does not leave when the wind dies. It is a water mass, and it persists for days (we covered this earlier in the study). So the filament is still parked offshore, full of nutrients and bait, even after the front passes. The wind just pushed it further out than it was sitting before.
Step 4: The incoming tide pushes the filament back in
When the north wind relaxes and the tide turns incoming, the water starts moving toward the reef instead of away from it. The incoming tide pushes the nutrient-rich filament water back toward the reef edge. The blue-to-purple edge shifts inshore. The bait comes with it. And the wahoo, which were holding and waiting, slide back in with it. The food is coming back to the fish.
This is the bite window. The incoming tide after a north wind relaxes is one of the best fall wahoo windows. The food is coming back to the fish. The edge is moving back into reach. The wahoo are ready to feed after the front shut things down. You are fishing the return of the good water, not the departure of it.
The timing catch: The wind relaxing and the tide turning incoming do not always line up perfectly. Sometimes the wind relaxes but the tide is still outgoing — so the filament stays out a bit longer. Sometimes the tide turns incoming but the wind is still blowing — so the push back is weak. The best window is when both happen together: wind relaxing AND incoming tide within a few hours of each other. Check the wind forecast and the tide table together. When you see the north wind dying and an incoming tide starting close together, that is your window.
One more thing to watch: This only works if the eddy is still there after the front passes. If the eddy itself broke down or moved away during the front, there is no filament to push back in. The tide cannot push water back if the water mass is gone. So check the latest chart. If the purple is still offshore, the incoming tide will bring it back. If the purple is gone, the eddy left and it is a different game.
Putting It All Together: Bottom + Temperature + Chlorophyll
The real power of the HD bottom map is when you stack it with the other SatFish layers. Here is how to use them together at the Thunderbolt. For the full wreck-by-wreck breakdown, see our Thunderbolt Wreck Marathon Fishing Guide — SatFish Maps & Wahoo Game Plan.
Bottom map (bathymetry)
Shows you WHERE the structure is — the wreck, the 20 Fa (120 ft) edge, the drop-off. This is the fixed part. It does not move.
SST (sea surface temperature)
Shows you the warm and cold water. Find the temperature band for your season (see the seasonal guide below) and see where that water is sitting on the bottom map. If the warm water is pushed up on the edge, the wreck is live. If it is pushed offshore, the edge is dead.
Chlorophyll (water color)
Shows you where the plankton and bait are concentrated. Clean blue water = low chlorophyll (pelagic water). Green water = high chlorophyll (bait water). Where the blue and green meet on top of a depth contour, that is your spot.
Worked Example From This Study (Sept 15 – 26)
Here is how the three layers stacked up during the wall-off, using the real data from this study:
Stack them and the picture locks in: The bottom map told you the edge was always there. The current layer told you the fast blue water was 15 miles offshore. The SST layer told you the warm water went with it. The chlorophyll layer told you the bait stayed behind on the reef. So during the wall-off, the smart play was not the long run offshore — it was fishing the inshore edge where the green bait water met the purple slow water right on the shelf drop-off.
When the wall snapped back (Sept 25): the current layer showed green pushing back to 4 NM, the SST layer showed warm water climbing back onto the edge, and the chlorophyll edge shifted inshore with it. All three layers agreed — the edge was live again. That is the power of stacking: when the layers line up on top of the same depth contour, you fish it. When they disagree, you wait.
The Research Behind This Study
Every claim in this study is backed by peer-reviewed oceanography. Here are the sources, in plain terms:
- Fratantoni, P.S., Lee, T.N., Podesta, G.P., & Muller-Karger, F. (1998). "The influence of Loop Current perturbations on the formation and evolution of the Tortugas eddies in the southern Straits of Florida." Journal of Geophysical Research: Oceans. This is the study that documented that Tortugas eddies push the Florida Current seaward. The Dry Tortugas wall going from 26 to 64 NM is the fingerprint this study predicted.
- Lee, T.N. & Williams, E. (1988). "Wind-forced and eddy-forced variability of the Florida Current." Journal of Geophysical Research. This study distinguished wind-driven pushes (which relax when the wind dies) from eddy-driven pushes (which persist as long as the eddy sits). The re-strengthening pattern we saw (6 to 15 NM at Alligator Reef) is the eddy fingerprint this study described.
- Kourafalou, V.H. & Kang, H. (2012). "Florida Current meandering and eddy formation off the Florida Keys." Journal of Geophysical Research: Oceans. This study documented eddy influence propagating from the lower Keys to Key Biscayne in about 11 days. It also documented filaments forming off Tortugas eddies as real, named features.
- Zhang, Z., et al. (2022). "Quasi-stationary cyclonic eddies in the southern Straits of Florida." Journal of Physical Oceanography. This study documented a Tortugas eddy that persisted for weeks. The September 15 wall-off peak fits a multi-week eddy event, not a short wind blip.
- Chérubin, L.M., et al. (2021). "Filament formation and nutrient transport off Tortugas eddies." Estuarine, Coastal and Shelf Science. This study documented that filaments form off Tortugas eddies and carry nutrient-rich water along the continental slope. The purple tongue on the charts is this feature.
How to read these sources: These five studies back the eddy and wall-off story. The wall data is from the Naval Oceanographic Office via NOAA. The charts are from SatFish. The research is what connects the colors on the chart to the fish in the water.
Want to Try SatFish? Here’s How to Save $20
I’m a proud SatFish affiliate — I have been using their HD bottom, Currents, SST, and chlorophyll maps every day on the water now for the past 4 years, and that’s exactly what this game plan is built on. Before you buy a full subscription, I recommend starting with the free trial so you can see the charts and the layers for yourself. Visit the SatFish website by clicking here.
If you decide to sign up for the yearly plan, use my code goodkarma at checkout and you’ll get $20 off your yearly subscription.
Frequently Asked Questions About Gulf Stream Dynamics & Wahoo Fishing
What causes the Gulf Stream "wall" to get pushed offshore in the Florida Keys?
A "wall-off" is triggered by mesoscale cyclonic eddies that form downstream near the Dry Tortugas. These massive, slow-spinning bodies of counter-clockwise water collide with the western edge of the Florida Current, deflecting the high-velocity stream miles seaward into the Straits of Florida.
While sustained wind can cause minor, brief surface shifts, only persistent eddy dynamics possess the kinetic energy to displace the core current 10 to 15+ nautical miles off the reef line for weeks at a time.
What does the color purple mean on a SatFish current-speed chart?
Purple indicates water velocity, not depth. On the SatFish current-speed scale, deep purple represents dead-slow water flowing between 0.0 and 0.5 knots. This signature flags eddy cores, slow countercurrents, and upwelled nutrient water along the shelf slope.
The high-speed core of the Florida Current reads green to red (2.5 to 4.0 knots). Once you understand purple equals slow velocity, the filament reads as a slow-moving tongue extending out along the reef tract.
How does sea surface altimetry help pinpoint wahoo?
Altimetry tracks Sea Surface Height Anomalies (SSHA), exposing the vertical displacement of water. Depressions in sea surface height indicate cyclonic upwelling, where cold, dense, nutrient-heavy water is pulled up toward the surface.
When this upwelled filament shears against adjacent warm downwelling zones (higher sea surface height), bait stacks tightly along the boundary line. High-speed trolling these altimetry gradients over drop-offs creates reliable strike zones.
Can local tides pull the Gulf Stream wall back inshore?
No. Tidal cycles lack the kinetic energy required to shift billions of gallons of moving ocean current 11 nautical miles back toward the Keys. The wall snaps back strictly when the Dry Tortugas eddy relaxes its offshore pressure.
However, strong full-moon spring tides serve as an oceanic broom: powerful outgoing tidal surges flush the lingering slow-water filament out of the gap rapidly once the main current begins its rebound.
Why does the chart show green water if the filament was purple hours earlier?
This is the difference between a water mass and water velocity. The purple color denotes a cold, nutrient-rich water mass moving at low speed. When an outgoing tide grabs that body of water and sweeps it offshore, the water accelerates.
The satellite chart switches from purple to green to reflect this temporary speed boost, but the biological payload—the temperature break, nutrients, and concentrated bait—remains intact.
When is the absolute best bite window to fish after a fall cold front?
The primary bite window opens when the hard north wind relaxes and lines up with an incoming tide.
Sustained northerly winds displace surface water and forage offshore via Ekman transport, quieting the nearshore bite. Once the wind eases and the tide floods inshore, the displaced nutrient filament and bait schools are driven back across the shelf drop-off, bringing hungry wahoo back to the reef line.
Why does official NOAA and Navy wall data lag behind real-time conditions?
The Naval Oceanographic Office runs computational models utilizing satellite data that is often 24 to 48 hours old. That data is then manually transcribed into marine text bulletins, which may update only once daily or slip behind schedule during major offshore storm events.
During rapid oceanographic changes—such as an 11-mile wall snapback occurring in 48 hours—text coordinates leave you running on outdated data. High-resolution satellite charts reveal real-time surface velocity changes before text forecasts refresh.
How do you stack bathymetry, SST, and chlorophyll to find pelagics?
Start with bathymetry to isolate permanent underwater structure, such as deep wrecks or the 120- to 300-foot shelf edge. Overlay Sea Surface Temperature (SST) to spot where thermal breaks push directly against that structure.
Finally, inspect chlorophyll-a to locate where clean pelagic blue water (low chlorophyll) meets nutrient-dense bait water (high chlorophyll). When an SST break, a chlorophyll boundary, and a bottom depth contour line up in the exact same zone, you have found your high-percentage target.